Dynatrace Architecture Design Guidelines
Companies increasingly turn to Observability tools to bolster their IT infrastructure in today’s fast-paced digital landscape. However, it’s not enough to procure these advanced solutions; what truly matters is how you design and implement them. With their intricate technologies and multifaceted internal components, Observability products demand strategic planning and thoughtful execution.
Imagine this journey as akin to charting a course through uncharted waters. The design of an observability/monitoring solution is not merely a technical endeavor; it’s a transformative odyssey that has the potential to revolutionize your entire IT operations. This voyage promises to redefine how your organization works, offering a new paradigm of efficiency and reliability.
But, and its significant “but,” making missteps during the discovery and design phase can cast shadows over the realization of these transformative benefits. It may result in costly rework, frustrations, and, most importantly, delays in reaping the rewards of an Observability solution.
Fear not; this article is your guiding star through these uncharted waters.
We will shed light on the intricacies of designing an Observability solution, focusing on one of the industry’s heavyweights, Dynatrace — a Gartner Magic Quadrant Leader. These insights are not just about avoiding common pitfalls; they are the compass points for navigating your architectural decisions and ensuring you set sail confidently.
Join us on this expedition as we uncover the essential tips and considerations to design your Observability solution, avoiding the pitfalls that plague the unprepared. By the time you reach the end of this article, you’ll be well-prepared to harness the full potential of Observability in your IT operations and set a course for smoother seas ahead.
Ready to embark on this journey? Let’s dive in and plot your course to Observability excellence.
Requirements Gathering

The first and most crucial step in this phase is to understand the company’s objective. Why do they need Observability? What are the results expected? How do they want to operate the tool? How is the company organized? Which methodologies is the company using? SRE? DevOps? FinOps? Agile? Are they on Cloud? Hybrid Cloud or just On-Premise?
I covered high-level strategy definitions in another article (https://medium.com/hybrid-cloud-survival-guide/producing-observability-design-to-support-a-hybrid-cloud-strategy-e783188b75e4).
So, After the Objective definition, we can review technical details aligned with the customer objectives and how Dynatrace can handle those requirements.
Start with the functional requirements to identify if the tool will satisfy all required capabilities, such as operating systems, platforms, middleware, and application languages. Dynatrace can satisfy the main technologies, programming language and middlewares but these items will not impact our architecture design here.
Then, you also need to determine which type of monitoring the tool needs to provide to satisfy all those functional requirements, for example, infrastructure monitoring, application performance management (APM), real user monitoring (RUM), Synthetic monitoring, etc. Dynatrace has robust solutions for all those kinds of monitoring, and each one will demand different configurations, infrastructure, and operations definitions where we will cover more on this article.
After funcional requirements, you can start the non-functional requirements to understand if the customer requires any exceptional security control, high availability, disaster, recovery, etc. Using Dynatrace SaaS, some of those non-functional requirements will be cover by the trird-party, if you decided for on-premise you will be responsible to cover those requirements.
If you need to know more about Observability Concepts, please take a look at this other article:
- Observability Concepts you Should Know: https://lnkd.in/dnpTYTkv
Solution Design

I will conduct the solution design based with some critical architecture decisions we should make to implement Dynatrace.
- SaaS or On-premise
This decision is one of the most common decisions for all solutions we need to implement, if we want to have the solution fully managed by a third party or if we prefer to manage by ourselves if we’re going to use a CaPex or Opex costs.
With SaaS, you don’t need to worry about the Dynatrace cluster; you will transfer this responsibility to the Dynatrace company, which will be responsible for the backup, disaster and recovery, patching, Dynatrace availability, and so on. Using SaaS, you will use the Opex model where you need to pay for services and don’t need to invest in equipment, except for some on-premise components we should have, like ActiveGates, which I will explain better.
With the On-Premise, you will be responsible for managing the Dynatrace Cluster, infrastructure, backup, disaster and recovery, patching, operating system maintenance, etc. Therefore, it would help if you also had people with good knowledge of the technologies used by Dynatrace Cluster. Using On-Premise, you will use the CaPex cost model if you decide to have it on your infrastructure.
The decision here will depend on the company’s requirements. Still, my preference is to use SaaS solutions, transfer the responsibilities we don’t want to take for third-party, and keep with us just the tool administration. But for sure, we can have situations where we are obligated to have an on-premise solution, for example, because of security policies and export regulations (e.g., ITAR — International Traffic in Arms Regulation).
- Network distribution
Usually, big companies have complex network infrastructures, and monitoring solutions must reach the whole environment. Dynatrace has a component called ActiveGate that supports us in monitoring these complex environments.
Dynatrace has variations of these AG:
Routing ActiveGates — Is used to centralize the OneAgent connection and is recommended to have one on each subnet with a firewall or networks with high latency. All OneAgents will try to connect on all available routing AG. To avoid you can implement Dynatrace Network Zones, which will limit the OneAgents to trying to connect only to specific AGs on their network environment.
Synthetic ActiveGates — Used to perform synthetic monitoring (artificial transactions). The AG will simulate a user from locations of your preference. For example, suppose the company has users from different countries, and you need to see the performance of an application from one or another country. In that case, you need to create one ActiveGate per each country you need the tests.
Zremote ActiveGate — Is used to monitor IBM Z systems, for example, CICS and IMS applications, mapping all the transactions end to end. The number and size of these Zremotes will depend on the number of MIPS consumed by each IBM Z Lpar, but generally, we cannot have more than 10 Lpars connected on each of those Zremotes.
Plugin ActiveGate — Is used to provide specific monitoring requirements for external access or where OneAgent doesn’t do natively.
It is crucial to implement an ActiveGates strategy to avoid the high costs of hosting to implement the solution.
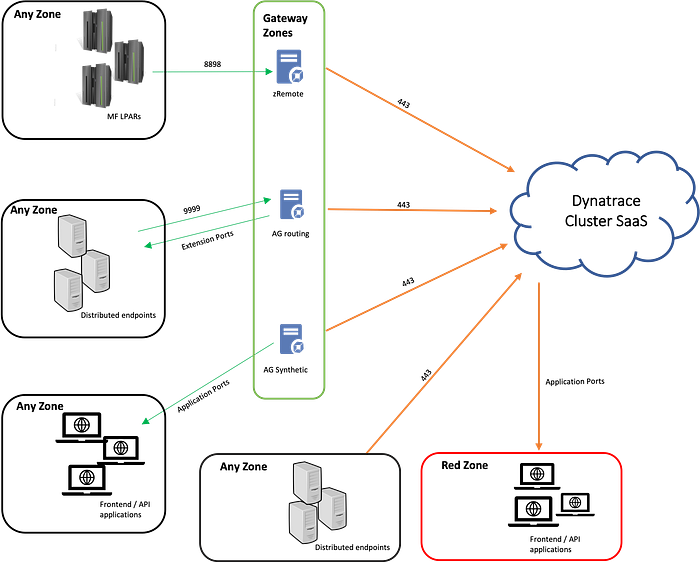
The image below shows an example of how to distribute Dynatrace components on your network. As you can see, some elements can connect to the Dynatrace environment without the need for an ActiveGate; some components can use ActiveGate or not, and some require the usage of an ActiveGate to communicate with the Dynatrace environment.
Dynatrace OneAgent can be connected directly to the Dynatrace backend but can also use Routing ActiveGates depending on the company network.
The Real User Monitoring will be connected directly to the Dynatrace backend without requiring an ActiveGate.
Mainframe and Synthetic monitoring require ActiveGates to send data to the Dynatrace Backend.
- Multi-tenant x Single tenant
These options will depend on the tool’s capability to provide these options; fortunately, we can do it on Dynatrace.
Multi-Tenant
The multi-tenant architecture concept can provide isolation of the same application (Dynatrace in this case) with the same infrastructure for different teams; each isolation is a tenant. Each tenant will be able to have their data, authentication, and permissions.
The multi-tenant on Dynatrace can be helpful, for example, if we want to avoid seeing production and development applications and infrastructure on the same view, or when we want to have isolation of a specific hosting environment or to provide monitoring for multiple customers. The component responsible for delivering it for Dynatrace is ‘Environment.’
A disadvantage of using multi-tenancy in Dynatrace when we have the same infrastructure to be monitored is that Dynatrace will lose the visibility to correlate problems, create topologies and monitor components shared among these different tenants. For example, a shared DB on an ‘Environment’ will not have this end-to-end visibility from applications being monitored by the other ‘Environment.’
A critical factor in this decision is the number of ActiveGates you need. The ActiveGate Plugins and ActiveGate Zremote are limited to work into the ‘Environments,’ so more Environments, more ActiveGates, and more infrastructure costs.
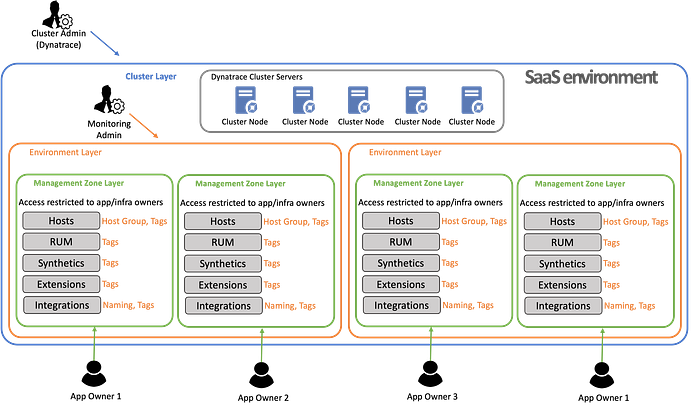
In the image below, you can see the operational model using a multi-tenant scenario on SaaS and the components used on each environment (tenant) to segregate the management activities among multiple teams:
Single Tenant
With a single-tenant approach, we will have everything in a single place, allowing Dynatrace to understand the environment end-to-end, provide correlations, apply the Davis AI to provide good root cause analysis and reduce the number of incidents.
The most common problem with using a single tenant approach is because of a lack of a fine-grained RBAC (Role Base Access Control), making it possible to give permissions for different teams to manage monitoring for just their applications without the risk of having a team breaking something for another application or infrastructure they are not responsible for.
Another disadvantage is to have a complex environment without isolation about what is dev and what is prod, and also having some visualization delays.
Dynatrace provides some features (Management zones Host Group and tags) in conjunction with RBAC to allow us to distribute administrative tasks for different teams just for their own application/infrastructure. However, this approach has some limitations; for example, the Management Zone team cannot configure integrations, extensions/plugins, or Kubernetes API. They need to have the ‘Environment’ administrators do it.
In the image bellow, you can see the operational model using a single-tenant scenario on SaaS and the components used to segregate the management activities among multiple teams:

Dynatrace components explation:
- Environment Component (Multi-Tenant): This component is responsible for providing the multi-tenancy; each ‘Environment’ is an isolated instance with its configurations, integrations, standards, user, and so on. But we must remember that using multiple ‘Environment’ will not allow the end-to-end correlations between the components from each ‘Environment.’ So, for example, if you want to create numerous ‘environments’ with the same infrastructure, you will break the PurePath (end-to-end correlation and Smartscape Topology).
- Management Zones: This Dynatrace component enables fine-grained access control on Dynatrace. You can design the Management zones for each application or each team to allow the users to access specific details and use tags to improve the component’s identification. However, management zones do not provide a separate tenant, so you cannot grant some special permissions to the management zones; that is why it is so important to have a good plan to implement them.
- Tags: This is a critical Dynatrace component used to identify and classify everything being monitored by Dynatrace, allowing the RBAC to provide fine-grained access control.
- Host Groups: This Dynatrace component can group multiple hosts to be used to set the members of the management zones.
The decision to use Multi-Tenant or a Single Tenant with RBAC needs to be made wisely; a Hybrid approach is always the best because we can bring the advantages of each scenario.
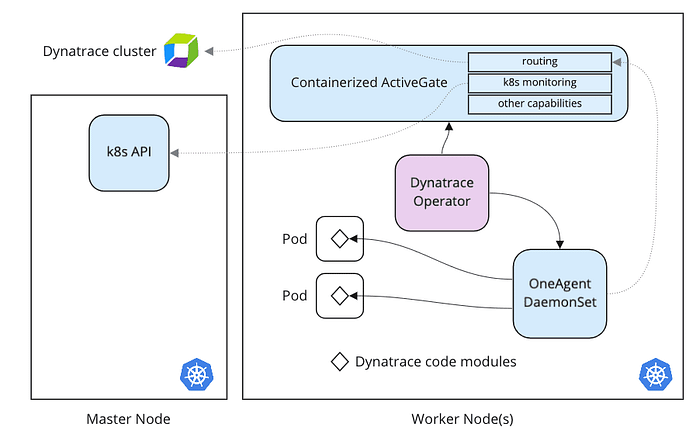
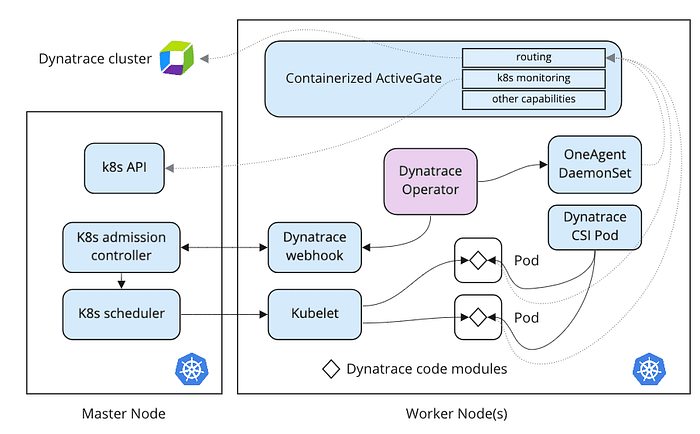
- Kubernetes (K8S)Based Clusters deployment mode decision
To monitor a K8S cluster, you should decide which components you want to monitor and how you want to monitor these components. To provide this flexibility, Dynatrace gives us some options, such as Full Stack Monitoring (Classic full-stack injection, Cloud-native full-stack injection), Application Monitoring Only: (Application-only monitoring: Automatic injection, Application-only monitoring: Pod runtime injection), or Host Monitoring. You can see more information on this link.
First, you should define if you need just host monitoring, application monitoring, or full-stack monitoring based on the company’s needs. I will focus here on the decision for full-stack monitoring options.
So, what is the best option for you? Classic full-stack injection or Cloud-native full-stack injection?
Dynatrace recommends using Classic full-stack injection as much as possible because this model doesn’t have some significant limitations, as you can see here: link. But, this model doesn’t have an excellent granularity to split monitoring by K8S Namespaces and the number of container rules (to allow us to configure the RBAC) as a low limit of rules.
On the other hand, Cloud-native full-stack injection, despite the documented limitations, can provide us with a better injection control using Namespace labels with a better RBAC granularity. So if you have a shared k8s cluster used by different teams and the list o limitations do not affect you, this is your option.
To learn more about the differences, look at this Dynatrace blog.
Conclusion
A good solution design is crucial for the success of Observability implementation; with that, we can identify the needs, cross the company objectives, and operational model with an Observability tool, allowing the companies to reach the goals.
Dynatrace is a powerful solution with excellent features to satisfy Observability targets, and most of what I covered here can be used for another tool with their particularities.
I hope this material helps you understand some basic details to support you in your Observability design.
Tiago Dias Generoso is a Distinguished IT Architect | Senior SRE | Master Inventor based in Pocos de Caldas, Brazil. The above article is personal and does not necessarily represent the employer’s positions, strategies or opinions.
Stackademic
Thank you for reading until the end. Before you go:
- Please consider clapping and following the writer! 👏
- Follow us on Twitter(X), LinkedIn, and YouTube.
- Visit Stackademic.com to find out more about how we are democratizing free programming education around the world.